Here’s what you need to know about LinkedIn metrics and reporting in 2024:
- Track key metrics: impressions, reactions, comments, shares, clicks, CTR, and follower growth
- Use LinkedIn’s built-in analytics for basic insights
- Leverage third-party tools for advanced reporting and competitor analysis
- Focus on content performance, audience growth, and engagement rates
- Calculate ROI to measure the effectiveness of your LinkedIn efforts
- Utilize AI tools like SuperTurtle.AI to enhance engagement and save time
- Compare your performance against industry averages
- Build a custom dashboard tailored to your business goals
- Report regularly: weekly for engagement, monthly for growth, quarterly for trends
- Stay updated on new LinkedIn metrics like AI skill adoption and content virality
Quick Comparison of Key LinkedIn Metrics:
| Metric | Measures | Why It Matters |
|---|---|---|
| Impressions | Visibility | Reach of your posts |
| Reactions | Emotional impact | Content resonance |
| Comments | Engagement level | Discussion generated |
| Shares | Content spread | Virality of posts |
| Clicks | User action | Content effectiveness |
| CTR | Link performance | Ability to drive action |
| Follower Growth | Audience size | Strategy performance |
By focusing on these metrics and using the right tools, you can boost your LinkedIn presence and achieve your business goals in 2024.
Related video from YouTube
LinkedIn Engagement Metrics Explained
LinkedIn engagement metrics show how your content performs. They help you understand your audience and your posts’ impact.
What Are Engagement Metrics?
These metrics measure how users interact with your content. Think likes, comments, shares, and clicks. The engagement rate? It’s the percentage of people who saw your post and took action.
Here’s the formula:
Engagement Rate = (Clicks + Likes + Comments + Shares + Follows) / Impressions * 100
Key Metrics to Watch
Focus on these to gauge your LinkedIn performance:
1. Impressions
How many times your post shows up on screens for at least 300 milliseconds. It’s all about reach.
2. Reactions
Likes, celebrates, supports – all the emotional responses. They show how your content hits home.
3. Comments
More comments? More discussion. It’s that simple.
4. Shares
When people share your post, your reach grows. It’s a big thumbs-up for your content.
5. Clicks
This is about action. How many times do users click on your links, images, or videos?
6. Click-Through Rate (CTR)
The percentage of people who clicked your link versus those who saw it. Here’s how you calculate it:
CTR = (Number of Clicks / Number of Impressions) * 100
7. Follower Growth
Are you gaining followers over time? This tells you if your strategy is working.
| Metric | Measures | Why It Matters |
|---|---|---|
| Impressions | Visibility | How far your posts reach |
| Reactions | Emotional impact | How your content resonates |
| Comments | Engagement level | How much discussion you spark |
| Shares | Content spread | How viral your posts go |
| Clicks | User action | How effective your content is |
| CTR | Link performance | How well you drive action |
| Follower Growth | Audience size | How your strategy performs |
Using LinkedIn’s Built-in Analytics
LinkedIn’s analytics tools are a goldmine for understanding your profile’s performance. Here’s how to tap into this data:
Finding the Analytics Dashboard
For personal profiles:
- Click "Me" > "View Profile"
- Scroll to "Analytics"
- Hit "Show all analytics"
For company pages:
- Click "Me" > "Company: [Your company name]"
- Select "Analytics" from the left panel
Reading LinkedIn Analytics Data
Once you’re in, you’ll see:
| Metric | Measures | Why It Matters |
|---|---|---|
| Content | Impressions, engagement | Shows post performance |
| Visitors | Views, demographics | Reveals audience info |
| Followers | Total and new followers | Tracks growth |
Focus on these areas:
1. Content Performance
Check "Post impressions" to see your reach. Look for what works and do more of it.
2. Audience Growth
"Total followers" shows if you’re gaining traction. Up is good.
3. Visitor Demographics
Use this to tailor your content. Speak their language.
4. Engagement Rates
Divide interactions by impressions. It tells you what content clicks with your audience.
To squeeze the most out of LinkedIn analytics:
- Set clear goals
- Check monthly (at least)
- Let data guide your strategy
- Export reports for deeper dives
Remember: LinkedIn analytics aren’t just numbers. They’re insights into what your audience wants. Use them wisely, and watch your LinkedIn game soar.
Advanced Reporting Methods
Want to squeeze more insights from your LinkedIn data? Let’s dive into some advanced techniques.
Third-Party Tools for LinkedIn
Built-in tools are great, but third-party options can take your analysis to the next level:
| Tool | Key Feature | Starting Price |
|---|---|---|
| Socialinsider | Campaign-specific analysis | $82/month |
| Inlytics | User-friendly dashboard | $12/month |
| Sprout Social | Performance summary | $199/month |
| Linked Helper | Profile analytics via scraping | $15/month |
These tools offer custom metrics, cross-channel analysis, automated reports, and competitor tracking. For instance, Sprout Social gives you a quick view of changes in impressions, engagements, and post link clicks. It’s like having a bird’s-eye view of your LinkedIn performance.
Combining LinkedIn with Other Analytics
To get the full picture, you need to mix and match your data sources:
1. Use Google Analytics with LinkedIn
Here’s a neat trick:
- Create a special URL for your LinkedIn ads using Google’s URL builder
- Use this URL in your LinkedIn campaigns
- Track the results in Google Analytics under Acquisition -> Campaigns
Now you can see how LinkedIn traffic behaves on your site. It’s like following your visitors from LinkedIn all the way to your website.
2. Connect multiple data sources
Tools like Pipes let you pull data from LinkedIn, Google Analytics, and 200+ other sources into one place. It’s like having all your data ingredients in one big mixing bowl. You can:
- Load everything into a central warehouse
- Analyze it with any business intelligence tool you like
- Set up automatic data pipelines
3. Automate with Zapier
Link Google Analytics 4 and LinkedIn Conversions without writing a single line of code. It’s like building a bridge between your platforms. This can:
- Speed up lead management
- Improve conversion tracking
- Create a single view of campaign performance
Checking Content Success
Want to boost your LinkedIn game? You need to know how your posts are doing. Let’s dive into tracking your content’s performance and making it more engaging.
Looking at Individual Post Stats
LinkedIn gives you the lowdown on each post. Here’s what matters:
- Views: How many eyeballs saw your post
- Likes, comments, and shares: How people interacted
- Clicks: Did folks click your links?
- Engagement rate: The percentage of people who engaged
To find these stats, head to your profile, click "Your Dashboard" under your bio, and hit "Post Views".
| Metric | Meaning | Why It Matters |
|---|---|---|
| Views | Times your post was seen | Shows your reach |
| Likes | People who liked your post | Indicates appeal |
| Comments | Comments on your post | Shows discussion level |
| Shares | Times your post was shared | Indicates value to others |
| Clicks | Clicks on your links | Shows interest in more info |
| Engagement Rate | Interactions / views | Overall post success |
Making Posts More Engaging
Want more interaction? Try these:
- Ask questions
- Use polls (they’re hot right now)
- Post when your audience is active
- Add eye-catching visuals
- Keep it snappy (under 150 characters)
"Polls are the top impression-generators on LinkedIn in 2024."
To see if these tweaks work:
- Check LinkedIn’s built-in analytics
- Track your engagement rate over time
- Note which post types get the most love
Understanding Your Audience
Want to boost your LinkedIn engagement? You need to know who you’re talking to. Here’s how to use LinkedIn’s audience analytics:
Follower Information
LinkedIn gives you the lowdown on your followers:
- Job titles
- Industries
- Company sizes
- Locations
- Seniority levels
To get this info:
- Go to your LinkedIn page
- Click "Analytics" in the top menu
- Hit the "Followers" tab
Here’s why this matters:
| Demographic | Why It’s Useful |
|---|---|
| Job Titles | Tailor content to roles |
| Industries | Focus on sector topics |
| Company Sizes | Adjust for org scale |
| Locations | Create local campaigns |
| Seniority Levels | Target decision-makers or newcomers |
Pro Tip: Export your follower data to Excel for deeper digging.
Visitor Data
Visitor analytics show who’s checking you out but hasn’t followed yet. This helps you:
- Spot potential followers
- See traffic trends
- Personalize your updates
To see visitor data:
- Go to your page analytics
- Click the "Visitors" tab
- Pick your date range (7-365 days)
Keep an eye on:
- Page views
- Unique visitors
- Visitor demographics
Use this to create content that turns visitors into followers.
For example: Seeing lots of tech visitors? Write about the latest tech trends.
Quick Tips:
- Compare follower and visitor demographics
- Use top post insights to refine your strategy
- Track audience growth to measure your impact
Tracking Conversions and Return on Investment
Let’s talk about measuring your LinkedIn efforts and figuring out if they’re paying off.
Setting Up Conversion Tracking
Here’s how to start tracking conversions:
- Go to LinkedIn Campaign Manager
- Click Analyze > Conversion tracking
- Hit Create conversion
- Choose Insight Tag conversion
- Name your conversion and pick a category
- Select your tracking method
- Review and update campaigns
Put the Insight Tag on all your website pages. It’ll make your tracking more accurate.
Calculating ROI from LinkedIn
Here’s a simple formula for ROI:
ROI = ((Amount gained - Amount spent) / Amount spent) x 100
| Metric | Calculation | Why It’s Important |
|---|---|---|
| Conversion Rate | (Conversions / Clicks) x 100 | Shows if your ads work |
| Cost Per Lead (CPL) | Total spend / Number of leads | Helps with budgeting |
| Customer Acquisition Cost (CAC) | Total marketing spend / New customers | Measures efficiency |
Keep an eye on these:
- Click Conversions
- View Conversions
- Conversion Rate
- Cost Per Conversion
- Total Conversion Value
Don’t forget to include all your costs – ads, content creation, and tools.
Want to boost your ROI? Try these:
- A/B test your ads and landing pages
- Fine-tune your targeting using audience data
- Make your content more engaging
sbb-itb-d5be3ae
AI Tools for LinkedIn Engagement
AI is shaking up LinkedIn in 2024. These tools are game-changers for creating content, boosting engagement, and saving time.
What Can AI Do on LinkedIn?
Most AI tools for LinkedIn offer:
- Content creation
- Post scheduling
- Engagement tracking
- Smart recommendations
They use fancy tech to understand LinkedIn’s content and how users behave. This helps them figure out when to post, what to write about, and how to get more eyes on your content.
SuperTurtle.AI: A LinkedIn Powerhouse
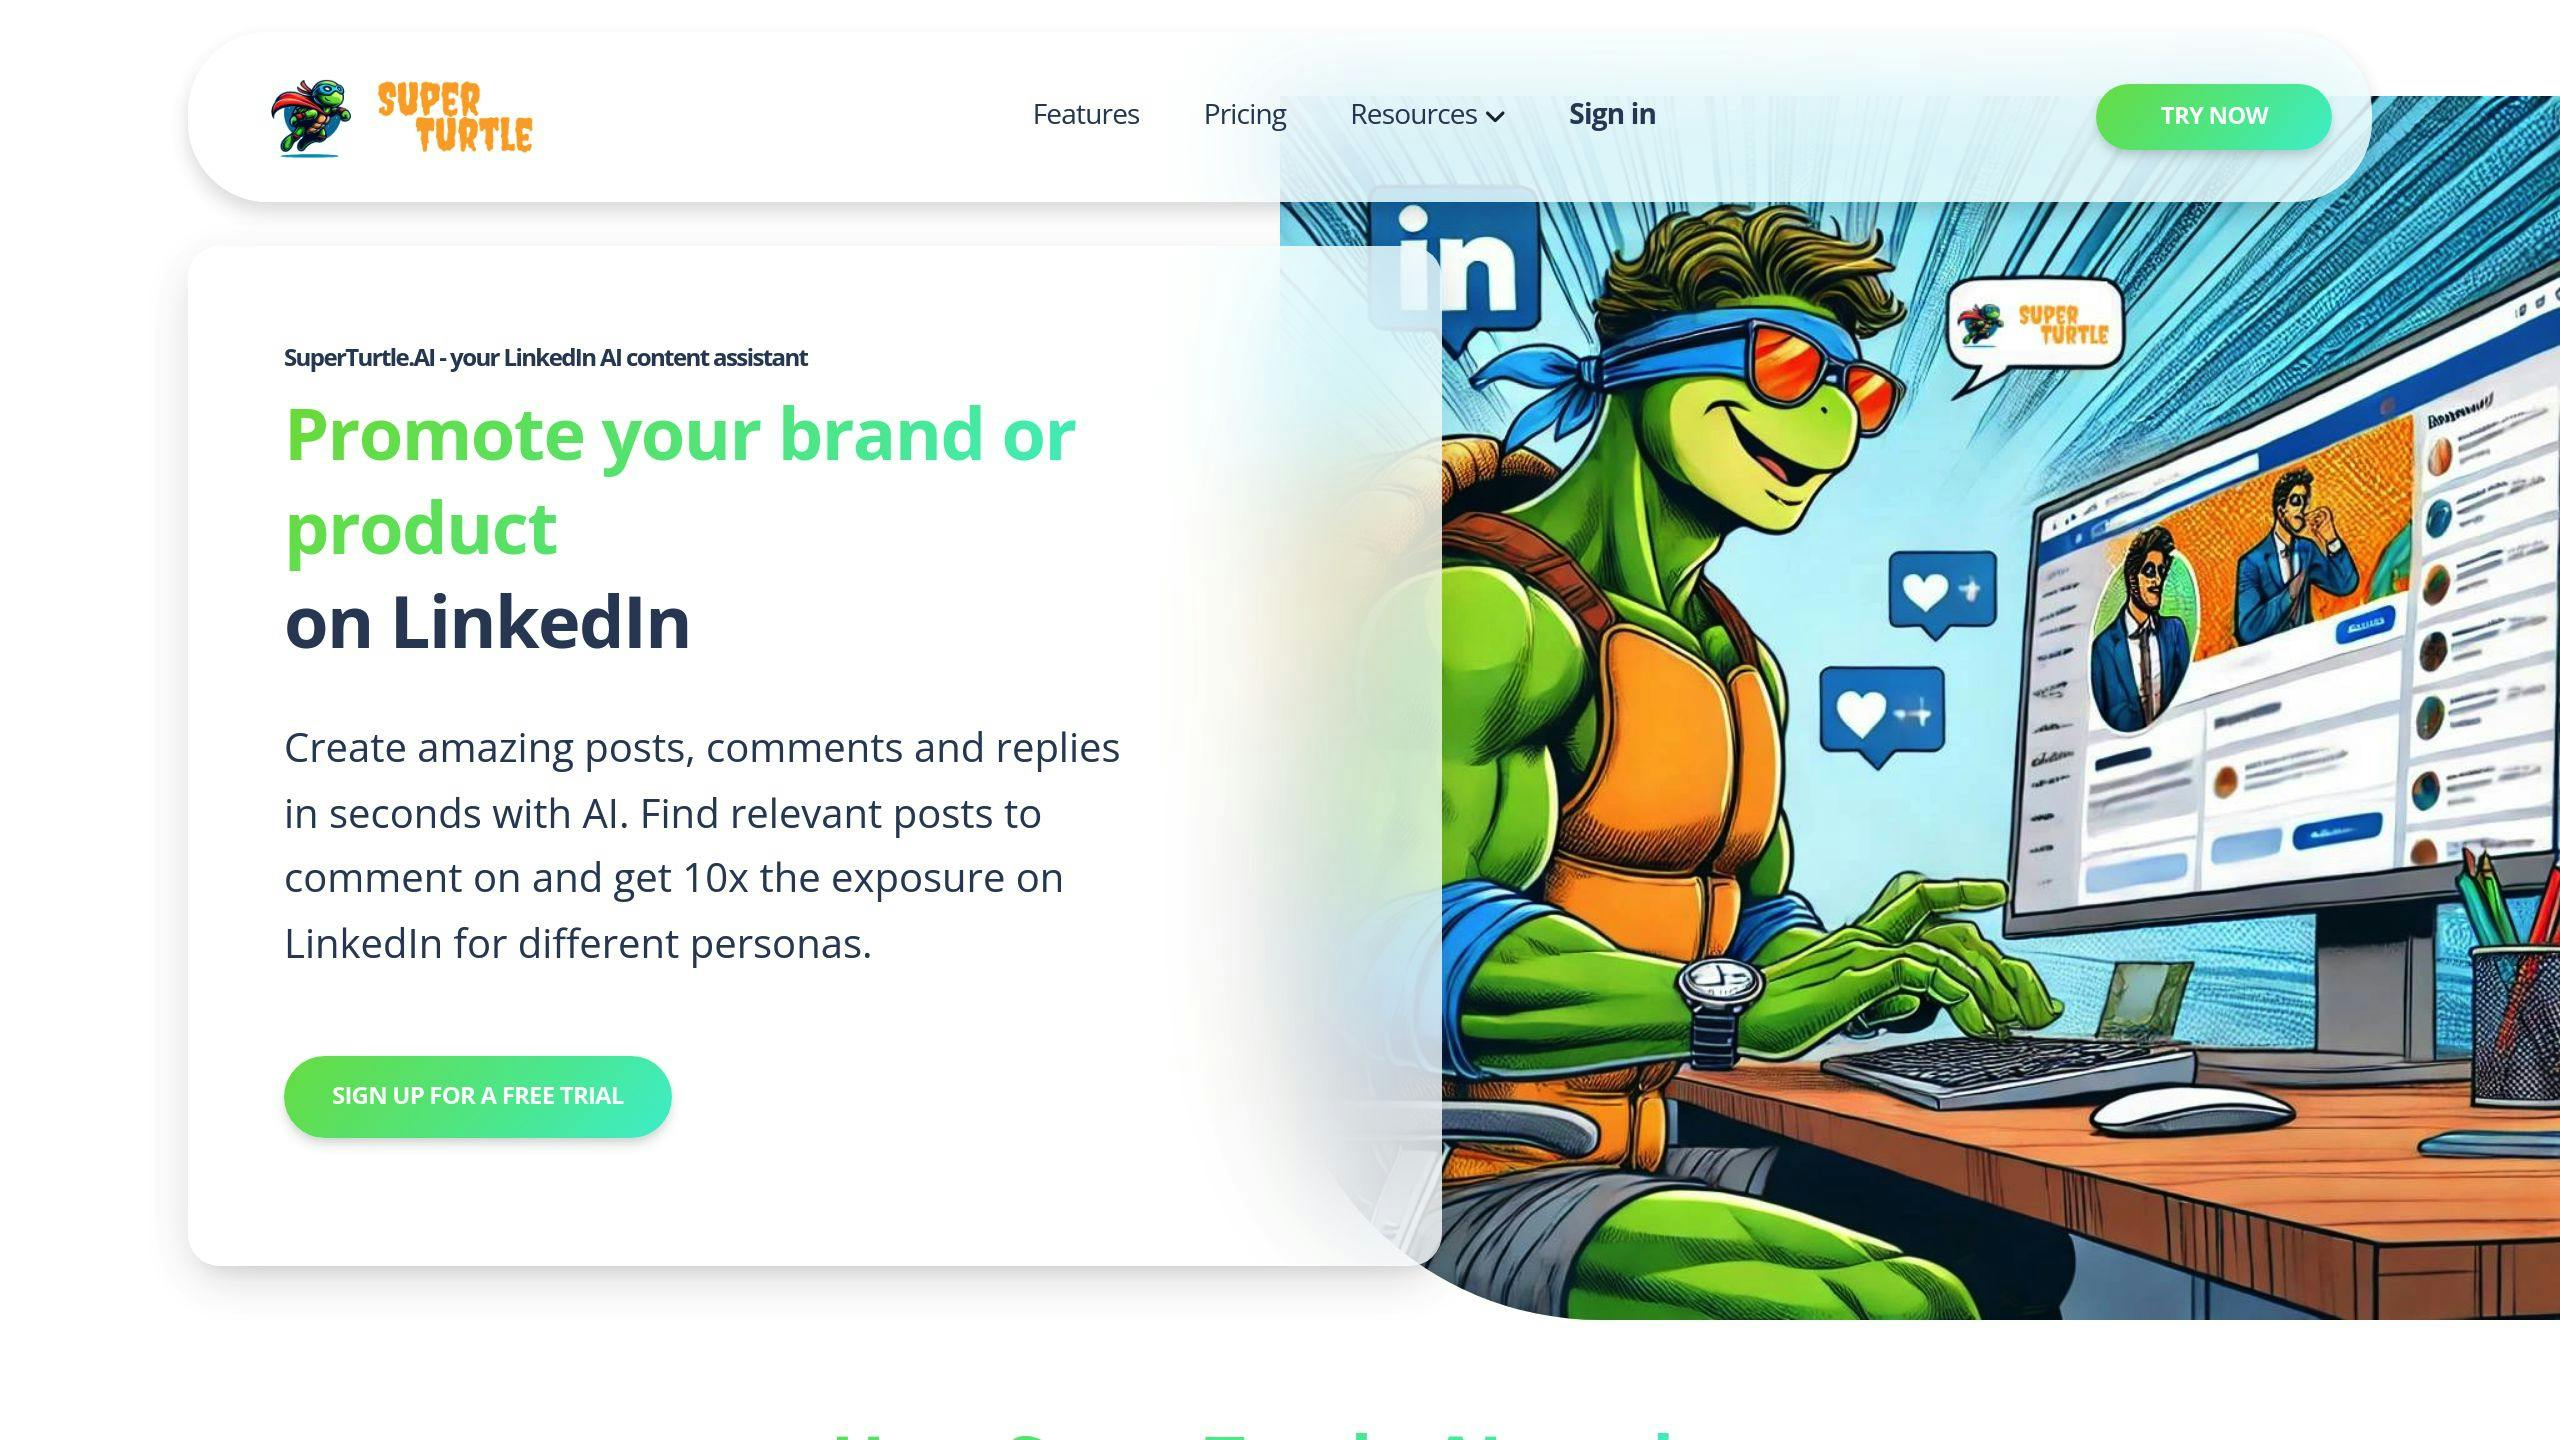
SuperTurtle.AI is making waves in the LinkedIn world. Here’s what it brings to the table:
| Feature | What It Does |
|---|---|
| AI Comments | Writes smart comments on posts |
| Post Creator | Helps you craft killer LinkedIn posts |
| Topic Finder | Digs up relevant posts for you to engage with |
| Chrome Add-on | Makes using LinkedIn a breeze |
| Multi-project Tool | Keeps your LinkedIn projects organized |
SuperTurtle.AI’s pricing is pretty straightforward:
| Plan | Cost | Monthly Comment/Post Limit |
|---|---|---|
| Basic | $0 | 10 |
| Pro | $9 | 100 |
| Premium | $29 | No limit |
The tool’s big idea? Let AI handle the grunt work so you can focus on landing leads. It keeps your LinkedIn buzzing without you having to live on the platform.
But here’s the thing: AI tools like SuperTurtle.AI are great, but use them wisely. Mix in your own voice to keep things real. After all, LinkedIn is about genuine connections, not just algorithms.
Comparing Your Performance
Let’s see how you stack up against others on LinkedIn. We’ll look at industry averages and competitor analysis.
Industry Averages
Here’s what the data shows:
| Metric | Industry Average |
|---|---|
| Engagement rate | 3.85% |
| Posts per week | 3.3 |
| Engagement rate (brands <5,000 followers) | 0.87% |
This comes from a study of over 58,000 LinkedIn posts in 2023.
Smaller accounts often see higher engagement rates. For accounts under 5,000 followers, video posts get about 16 views per 100 followers.
Want to match top performers? Aim for:
- 3,120+ connections on your personal profile
- 1,226+ followers on your company page
- 47+ views and 26+ reactions per article
Checking Competitor Activity
Here’s how to spy on your rivals:
1. Use LinkedIn’s built-in tools
Go to your Company Page in "Super admin view". Click Analytics > Competitors. You can compare up to 9 competitors.
2. Track key metrics
Look at:
- Follower growth
- Post frequency
- Engagement rates
- Content types (text, image, video)
3. Analyze top-performing posts
What’s working for others? Polls? Multi-image posts? Videos?
4. Calculate ROI
LinkedIn organic ROI varies by industry:
| Industry | Average 3-year ROI |
|---|---|
| Staffing & Recruiting | 529% |
| Financial Services | 390% |
| B2B Software / SaaS | 388% |
5. Set benchmarks
Try to be in the top 25% of your industry. For example:
- 5+ comments per status update
- 2+ reshares per article
- 6-8 months until first lead results
But remember: these are just averages. Your goals should fit YOUR specific situation and growth stage.
Building a LinkedIn Reporting Dashboard
Want to track your LinkedIn performance? Let’s build a dashboard.
Key Dashboard Components
Here’s what to include:
| Metric | What It Means |
|---|---|
| Impressions | How many people saw your content |
| Engagement rate | How many people interacted with your content |
| Follower growth | How many new followers you’re getting |
| Click-through rate | How many people clicked on your content |
| Video views | How many people watched your videos |
Setting it up:
- Go to LinkedIn Analytics on your company page
- Export your data as CSV files
- Put that data into a spreadsheet (like Google Sheets)
- Make some charts and graphs
- Keep it updated
Tailoring Dashboards
Not everyone needs the same info:
- Bosses want the big picture and ROI
- Content creators need engagement rates and top posts
- Sales teams care about leads
Here’s a cool example: Hootsuite grew their LinkedIn from 0 to 278,000 followers. How? They used dashboards to track things like post views and search appearances.
"Don’t expect miracles overnight. Slow, real growth beats quick growth with uninterested followers." – Jennifer Heimann, AVP at L&L Collective
Tips for LinkedIn Engagement Reporting
How Often to Report
Tracking LinkedIn metrics isn’t a one-off task. It’s ongoing. Here’s a simple breakdown:
- Weekly: Check likes, comments, and shares.
- Monthly: Look at follower growth and post performance.
- Quarterly: Analyze big-picture trends and tweak your strategy.
Brian Ferritto from 42connect puts it well:
"It’s our job to tell a simple story through reporting to our clients. The report is the client’s proof that what we are doing is benefiting their business in a positive way."
Linking Metrics to Business Goals
Don’t track numbers just because. Tie your LinkedIn metrics to what your business wants to achieve:
| Business Goal | LinkedIn Metrics to Track |
|---|---|
| Brand Awareness | Follower count, post reach, mentions |
| Lead Generation | Click-through rates, form fills |
| Website Traffic | Clicks to website, traffic from LinkedIn |
| Thought Leadership | Engagement on thought leadership content |
Here’s how to make your reporting count:
- Use clear, simple language.
- Add charts to show key findings.
- Be upfront about data limitations.
- Suggest next steps based on what you’ve learned.
The point? Use data to boost your LinkedIn game and get more bang for your buck.
Pro tip: Tools like Sprout Social can help you track daily changes and long-term averages. This gives you a fuller picture of how you’re doing on LinkedIn.
What’s Next for LinkedIn Analytics
LinkedIn’s analytics tools are changing in 2024. Here’s what’s coming and how to get ready.
New Metrics to Watch
LinkedIn is adding new ways to measure your success:
| Metric | Measures | Why It Matters |
|---|---|---|
| AI Skill Adoption | AI skills growth on profiles | Shows AI trends |
| Content Virality Score | Content spread beyond your network | Measures content reach |
| Cross-Platform Engagement | Interactions across LinkedIn and Microsoft | Shows total audience reach |
These new metrics show how professional networking is changing. For example, LinkedIn saw a 142x jump in members adding AI skills to their profiles. Writers, designers, and marketers are leading this trend.
Getting Ready for Changes
Here’s how to prepare:
1. Boost AI Literacy
80% of employees want to learn AI skills, but only 38% of U.S. executives are helping. To fix this:
- Use LinkedIn’s 250 free AI courses (until April 5, 2024)
- Start AI training in your company
2. Use Augmented Analytics
This uses AI to make data analysis easier. To get ready:
- Look for AI-powered analysis tools
- Train your team to use AI insights
3. Focus on Data Privacy
LinkedIn will likely add more secure analytics features. To prepare:
- Check your data handling practices
- Watch for LinkedIn’s data security updates
4. Use More Video Content
Video is becoming big on LinkedIn. To take advantage:
- Create more video content
- Use LinkedIn’s video analytics to improve
Conclusion
LinkedIn engagement metrics are key for pros and businesses looking to boost their platform presence. Here’s what matters:
- Use LinkedIn Analytics to guide your content strategy
- Focus on likes, comments, and shares
- Video posts often get more views
- Smaller accounts can see higher engagement rates
- Keep an eye on your metrics regularly
Why These Metrics Count
Engagement metrics are crucial for LinkedIn success:
1. Know Your Audience
They show what content clicks with your followers. Make more of what works.
2. Improve Your Game
Analyze the data to fine-tune your approach over time.
3. Measure Results
Use these metrics to calculate your LinkedIn ROI.
4. Stay Ahead
Understanding your metrics helps you outpace competitors.
5. Roll with Changes
As LinkedIn evolves, tracking engagement helps you adapt.
| Metric | Why It’s Important |
|---|---|
| Engagement Rate | Shows content resonance |
| Follower Growth | Indicates potential reach |
| Impressions | Measures content visibility |
| Click-through Rate | Reflects content appeal |
With over 930 million pros across 200 countries, LinkedIn is a B2B marketing goldmine. Focus on these metrics to tap into this network effectively.
Use these insights to drive real interactions with your audience. LinkedIn’s tools, plus third-party options, offer powerful ways to track and boost your performance in 2024 and beyond.
FAQs
How do I get better LinkedIn Analytics?
Want to boost your LinkedIn Analytics? Here’s what to do:
- Set clear goals. What do you want? More engagement? More followers? More website clicks?
- Get your team involved. Ibby Hussain, VP of Digital & Creative at Vested, says: "Employees are your best advocates on LinkedIn. They drive engagement and reach."
- Start conversations on LinkedIn. The more people talk, the more the algorithm likes you.
How do you measure performance on LinkedIn?
LinkedIn’s main performance metric is engagement rate. Here’s the math:
Engagement Rate = (Clicks + Likes + Comments + Shares + Follows) / Impressions
This percentage shows how much people like your stuff. Other important numbers:
| Metric | What it Tells You |
|---|---|
| Impressions | How many times people see your content |
| Click-through Rate | How often people click your content |
| Follower Growth | How fast you’re gaining followers |
| Profile Views | How many times people look at your profile |
Jennifer Heimann from L&L Collective has some advice: "Be realistic! Slow, real growth beats quick growth with uninterested people."